Translate this page into:
Variations in antioxidant status in ischemic stroke: A case control study in Indian population
Corresponding author: Krishnan Hajela, Department of School of Life Sciences, Devi Ahilya Vishwavidyalaya, Indore, Madhya Pradesh, India. hajelak@gmail.com
-
Received: ,
Accepted: ,
How to cite this article: Choudhary K, Rawaliya RK, Kohli B, Ali A, Patel PK, Kumari B, et al. Variations in antioxidant status in ischemic stroke: A case control study in Indian population. J Health Sci Res 2023;8:38–44.
Abstract
Objectives
An imbalance between the levels of oxidants and antioxidants, a state of oxidative stress, leads to production of Reactive Oxygen Species. Overproduction of these species plays a crucial role in pathogenesis of ischemic stroke. In view of this, we aimed to investigate the markers of oxidative stress along with blood cellular components in ischemic stroke patients and healthy controls.
Material and Methods
Blood samples of 68 patients and 52 aged-matched controls were analyzed for oxidative stress markers such as glutathione peroxidase (GSHPx) and reduced glutathione (GSH) were assayed along with catalase and superoxide dismutase (SOD). Ferric-reducing antioxidant power (FRAP) of plasma of all samples was also evaluated along with complete blood count.
Results
In patients, the activities of the oxidative stress marker enzyme, GSHPx, was found to be significantly elevated (P ≤ 0.01), with significantly low levels of GSH (P ≤ 0.01), while the activities of catalase and SOD were found unaltered. The total antioxidant capacity of plasma measured as FRAP was also significantly higher (P ≤ 0.05). Red blood cells (RBCs) and eosinophils counts were found to be significantly lower (P ≤ 0.05 and P ≤ 0.01, respectively) while that of monocytes were significantly higher (P ≤ 0.01) in comparison with the controls.
Conclusion
Our results showed that the antioxidant status of ischemic stroke patients was better than the control subjects, which may have been due to the compensatory mechanism being activated due to oxidative stress.
Keywords
Ferric-reducing antioxidant power
Ischemic stroke
Oxidative stress
Free radicals
Inflammation
INTRODUCTION
Brain, the key organ of our body, gets oxygen and nutrients from the continuous blood supply through cerebral arteries. The supply when disrupted affects the functioning of neurons. There may be many predisposing factors which may cause hindrance to regular blood flow to brain, thereby depriving the brain cells of oxygen leading to metabolic dysfunction and cell death, a condition called ischemic stroke. Apart from the common documented risk factors such as hypertension, smoking, diabetes, abdominal obesity, dyslipidemia, excessive alcohol consumption, and physical inactivity, oxidative stress is a crucial pathophysiological marker involved in ischemic stroke.[1]
Oxidative stress refers to increased levels of reactive oxygen species (ROS) due to an imbalance between the levels of oxidants and antioxidants. ROS if present in excess bind irreversibly to vital biomolecules of cells such as lipids, proteins, and nucleic acids, thereby damaging them and disrupting the cellular functions.[2] Though ROS play an important role in normal physiological processes, they have also been implicated in a number of disease processes including cell injury in ischemic stroke. The antioxidants such as reduced glutathione (GSH) and enzymes such as glutathione peroxidase (GSHPx), glutathione reductase (GR), superoxide dismutase (SOD), and catalase have a scavenging role that counter the toxic effects of oxidants and maintain a balance between production of ROS and their removal by maintaining antioxidant potential.[3–5] Oxidative stress is associated with hyperoxia, and the brain with higher oxygen and glucose demand for higher oxidative metabolic activity therefore becomes the most vulnerable organ in terms of production of ROS and their deleterious effects.[6] However, hypoxia in the brain can also cause production of many reactive species because oxygen-deficient cells rely on anaerobic glycolysis and produce lactate to make energy during low concentrations of molecular oxygen. With relatively low levels of endogenous antioxidant enzymes in brain,[7] ROS produced during ischemic and reperfusion phases of ischemic stroke can damage cerebral tissue that may induce inflammatory response, resulting in the production of proinflammatory markers by the immune cells.[8] The neutrophils and monocytes recruited at the site of injury collaboratively contribute to ischemic brain injury. Thus, the role of inflammation also appears to be very important in pathogenesis of ischemic stroke.
Studies on blood cellular components in ischemic stroke have reported erythrocyte damage, leukocyte activation, and eosinophil dysregulation.[9,10] The macrophage activation and alteration of the blood–brain barrier occur before the onset of stroke and might induce it further.[11] The resident macrophages of the brain, microglial cells, and systemic monocytes or macrophages have morphologically and functionally similar roles in stroke.[12,13]
Various studies on stroke have reported it as the third major cause of death worldwide.[4] Disability after the ischemic event is a big burden on the society and family, which drives the focus of researchers to get further insight into the disease. In view of this, many studies on oxidative stress markers of ischemic stroke patients have been done,[5,14–22] but the conflicting data of these studies failed to correlate the disease association. Some authors have reported lower antioxidant enzyme activity,[15,16,18–21] while few have reported higher activity.[5,17–22] Also, no significant differences in the levels of antioxidant enzymes in patients and age-matched controls have been reported.[14] There could be many factors that are involved in the pathogenesis of the disease, including the role of blood cellular components as part of the inflammatory process. Therefore, it is important to review and reassess the plasma levels of various oxidative stress markers in different settings. Thus, in the context of the Indian population, a study on oxidative stress along with blood cellular parameters in ischemic stroke and age-matched controls was performed.
MATERIALS AND METHODS
Sample collection
The study was approved by the Ethical Committee of Devi Ahilya Vishwavidyalaya, Indore (Dev-III/Ethical Committee/Life Sc./2014). Blood samples (68 patients and 52 controls) were collected with prior consent from ischemic stroke patients and their attendants as healthy controls within 24 hours of onset of stroke. The blood was collected in ethylenediaminetetraacetic acid (EDTA) vials (Becton Dickinson Vacutainer®), and plasma was obtained by spinning the blood samples at 2800 revolutions per minute (RPM) for 10 minutes. The plasma was stored at −20°C until further use. The total protein in the plasma was quantified by Lowry’s method.[23]
Measurement of glutathione peroxidase activity (GSHPx) in plasma
Glutathione peroxidase (GSHPx) activity was measured by the method performed by Mohandas et al.[24] GSHPx enzyme catalyzes the reduction of hydrogen peroxide and organic peroxides (R-OOH) to corresponding stable alcohols (R-OH) and water using glutathione as the reducing agent.
Measurement of reduced glutathione (GSH) level in plasma
Reduced glutathione level in the plasma was measured by modification method of Ellman (1959) in which sulfhydryl groups were quantified by addition of 5,5-dithiobis-(2-nitrobenzoic acid) [DTNB].[25] It reacted with-SH group of GSH to produce a yellow-colored 2-nitro-5-mercaptobenzoic acid, the absorbance of which was measured at 412 nm. The result was expressed in µg GSH/mg protein.
Measurement of catalase activity in plasma
Catalase activity was measured as referred by Aebi et al. [26] based on the decomposition of hydrogen peroxide (H2O2) by the enzyme. The disappearance of H2O2 in the presence of enzyme and control was measured at 240 nm. The activity was measured as unit/mg of protein.
Measurement of the activity of superoxide dismutase (SOD) in plasma
The enzyme activity was measured as inhibition of pyrogallol auto-oxidation.[27] The rates of pyrogallol auto-oxidation and inhibition were monitored at 420 nm. 50% inhibition of pyrogallol auto-oxidation was considered as 1 SOD unit.
Ferric-reducing antioxidant power (FRAP) of plasma
In this method, pale yellow Fe(III)- tripyridyltriazine (Fe(III)-TPTZ) complex was reduced to blue Fe(II)-tripyridyltriazine (Fe(II)-TPTZ) by ferric-reducing ability of the plasma,[12] which was quantified by monitoring at 593 nm using standard Fe(II) solution. The results were expressed as FRAP value µM/L of plasma.
Measurement of complete blood count (CBC)
Complete blood count was performed by an automatic counter machine (Auto Blood Cell Counter Machine -XP-300), which is routinely used in hospitals.
Statistical analysis
The statistical analysis was performed using R-for statistical computing. A nonparametric data set was obtained after sampling. The variables including age, gender, associated clinical conditions, and so on may affect the sampling. Mann–Whitney U test for nonparametric data was used for the analysis, and alpha = 0.05 was considered significant.
RESULTS
The different markers of oxidative stress, analyzed in the plasma of controls and patients summarized in [Table 1], are expressed as box plots in figures. The oxidative stress marker enzyme, glutathione peroxidase, was significantly elevated (P = 0.01) in the patient group as compared to control [Figure 1], whereas the superoxide dismutase and catalase levels were found unaltered [Figures 2 and 3, respectively]. The levels of reduced glutathione were also significantly low in patients (P = 0.01) [Figure 4]. However, the total antioxidant capacity of plasma, measured as FRAP, was significantly higher in case of patients (P = 0.05) [Figure 5]. The comparison of blood components in patients with that of the healthy controls is shown in [Table 2]. The deviation in cell counts was also observed [Figure 6].
| S. No. | Oxidative stress parameter | Control | Patient | Significance level |
|---|---|---|---|---|
| 1. | Glutathione Peroxidase (GSHPx) (µg GSH consumed/mg protein) | 0.238 ± 0.015 (n = 40) | 0.361 ± 0.028 (n = 45) | P = 0.01 |
| 2. | Superoxide Dismutase (SOD) (U/mg protein) | 0.141 ± 0.015 (n = 30) | 0.548 ± 0.145 (n = 37) | P = 0.508 |
| 3. | Catalase (H2O2 consumed/mg protein/minutes) | 0.193 ± 0.023 (n = 42) | 0.18 ± 0.010 (n = 68) | P = 0.3609 |
| 4. | Reduced Glutathione (GSH) (µg GSH/mg protein) | 0.712 ± 0.051 (n = 52) | 0.487 ± 0.035 (n = 55) | P = 0.01 |
| 5. | Ferric-reducing antioxidant power (FRAP) (µM/L of plasma) | 476.52 ± 16.57 (n = 50) | 565.20 ± 22.69 (n = 65) | P = 0.05 |
n: different number in each assay was due to serum not sufficiently available in all samples.
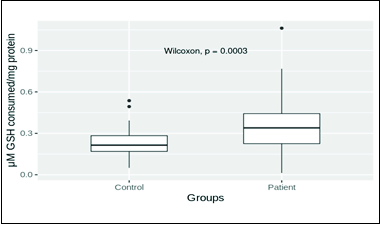
- Glutathione peroxidase (GSHPx) distribution in patient and control groups. Mean values of control and patient groups were 0.238 ± 0.015 (n = 40) and 0.361 ± 0.028 (n = 45), respectively. The mean glutathione peroxidase level in patients was significantly higher (P = 0.01).
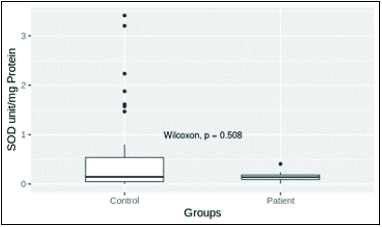
- Superoxide dismutase (SOD) level in patient and control groups. Mean values of control and patient groups were 0.141 ± 0.015 (n = 30) and 0.548 ± 0.0145 (n = 37), respectively. The mean SOD levels in patient and control groups were not significantly different (P = 0.05).
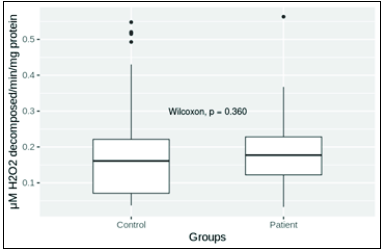
- Catalase level in patient and control groups. Mean levels in control and patient groups were 0.193 ± 0.023 (n = 42) and 0.18 ± 0.010 (n = 68), respectively. Mean levels of catalase in patient and control groups were not significantly different (P = 0.05).
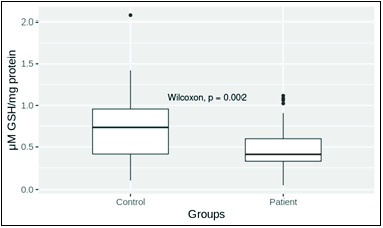
- Reduced glutathione (GSH) level in patient and control. Mean plasma levels in control and patient groups were 0.712 ± 0.051 (n = 52) and 0.487 ± 0.035 (n = 55), respectively. The mean level of reduced glutathione in patient group was significantly low (P = 0.01).
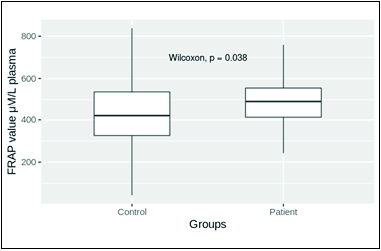
- FRAP of plasma in control and patient groups. Mean levels in control and patient groups were 476.52 ± 16.57 (n = 50) and 565.20 ± 22.69 (n = 65), respectively. The mean FRAP level in the patient group was significantly high (P = 0.05).
| No. | Complete blood count parameters |
Control (n = 42) |
Patient (n = 30) |
Significant |
|---|---|---|---|---|
| 1 | RBCs (million/mm3) | 4.721 ± 0.096 | 4.296 ± 0.143 | P = 0.05 |
| 2 | Monocytes (% in WBCs) | 1.214 ± 0.105 | 1.666 ± 0.175 | P = 0.01 |
| 3 | Eosinophils (% in WBCs) | 2.214 ± 0.154 | 1.566 ± 0.269 | P = 0.01 |
RBC = Red blood cells, WBC: White blood cells.
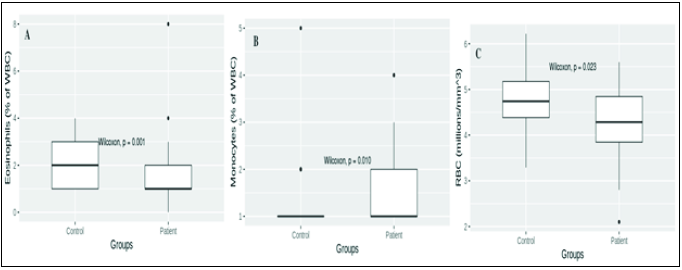
- CBC parameters of control (n = 42) and ischemic stroke patient (n = 30). (A) Eosinophil values in control and patient groups were 2.214 ± 0.154 and 1.566 ± 0.269% of white blood cells (WBC), respectively (P 0.01); (B) Monocytes values in control and patient groups were 1.214 ± 0.105 and 1.666 ± 0.175% of WBC, respectively (P 0.01); (C) RBCs values in control and patient groups were 4.721 ± 0.096 and 4.296 ± 0.143 million/mm3, respectively (P 0.05).
DISCUSSION
Eukaryotic cells get protection against ROS by the presence of antioxidants. Increased ROS production is associated with excessive oxygen consumption during heightened oxidative reactions. The toxic levels of ROS may lead to endothelial dysfunction, leading to the formation of arteriosclerotic plaques.[9] The endothelial dysfunction becomes critical when it involves cerebral vasculature, which has a role in development of ischemic brain stroke.[28] Some earlier studies have proposed that oxidative stress plays a key role in brain injury that follows a stroke.[29,30] Oxidative stress has been implicated in ischemic stroke, which follows neuroinflammation, and therefore the role of the innate immune system becomes important.[1]
Brain cell vulnerability to ROS toxicity has been well understood owing to higher content of membranous fatty acids. Hence, this may play a major role in the pathogenesis of ischemic stroke.[25] The balance between the level of oxidative stress and antioxidant capacity is an important factor that provides protection against cellular damage,[7,31] due to the scavenging action of antioxidants, which plays a key role in preventing cellular damage under excessive oxidative stress.[7,32] This study analyzed the levels of antioxidant markers to assess the oxidative stress in patients who suffered ischemic stroke.
As far as antioxidant enzymes are concerned, the brain has poor catalase activity and only moderate amounts of SOD and GSHPx.[33,34] The GSH and GSHPx are powerful antioxidants in humans that provide protection from ROS.[34] Our results showed significantly elevated levels of GSHPx and low levels of GSH in plasma of patients with ischemic stroke. The GSH was used up by the overactive GSHPx, which explains its low levels in our findings. Also, Hunter et al. reported that under persistent oxidative stress, GSH level decreases severely inside the cell, resulting in increased levels of ROS, which cause cell damage.[35] The GSHPx from the damaged cells may leak into the circulation, a probable reason behind its increased activity in the plasma as shown in our results. Our findings were in accordance with the other studies done in erythrocytes,[19,20] plasma,[15] and serum.[5] Studies performed on various animals also claimed that GSHPx plays a protective role ischemic brain damage, while low levels of GSHPx augment the event of stroke.[21,36]
The SOD and catalase activities in the plasma of ischemic patients remained unchanged in our study findings. The SOD enzyme activity has been reported differently in acute ischemic stroke.[4] The studies by Cherubini et al.[19] and Demirkaya et al.[20] found significantly reduced SOD activity, while that of El Kossi and Zakhary[14] did not find a significant change in serum SOD activity. This may be attributed to the existence of different SOD isoforms and variations in the methods used to measure SOD activity.[4] Also, the SOD gets regenerated endogenously,[14,37] majorly the intracellular fraction that participates in the process of free radical scavenging, thus maintaining its extracellular levels in plasma,[14] which may explain the insignificant difference of SOD levels in patients compared to controls in our study.
Further, the catalase having the highest turnover number neutralizes millions of hydrogen peroxide molecules in the cell,[38] thereby not getting affected by increased ROS levels. A study on acute ischemic stroke patients reported no significant change in the activities of SOD and catalase with regard to points of follow-up when compared between the subgroups of diseased and survived patients.[33] This study also stated that antioxidative protection does not have important predictive significance in these patients.
The oxidative stress in ischemic stroke patients as evaluated by the total antioxidant capacity of plasma, which is considered a cumulative effect of various biochemical antioxidants present in it, which provides protection against oxidative stress,[39] was found to be significantly higher in our study.
Blood cells in systemic inflammatory processes influence the susceptibility and pathogenesis of ischemic stroke,[6,7,31,32,34] and inhibiting these inflammatory responses may improve the clinical outcome by decreasing the infarct size and neurological deficit in experimental stroke.[14,15] The inflammatory cells such as monocytes and the resident microglial cells of the brain have roles in stroke.[12,13] The microglial cells produce inflammatory cytokines (including interleukin-1 [IL-1] and tumor necrosis factor-alpha [TNF-alpha]) and chemokines in response to brain injury,[40] which facilitate further recruitment and infiltration of other inflammatory cells.[41–43] Our findings on increased monocyte count may explain their role in attenuation of ischemic stroke–induced brain damage. Guo et al. (2015) suggested that eosinophil counts might have a significant impact on outcomes in stroke patients. In our study, the eosinophil counts were found to be significantly low.
The oxidative stress and inflammation are major factors that disrupt the integrity of RBCs and reduce their count in ischemic stroke.[44,45] However, these factors have also been reported to influence the RBC production, their survival rate, and erythropoietin level.[46,47] Anemia due to low hemoglobin owing to low RBC count acts as a predictive biomarker for ischemic stroke among the Indian population.[48] We have noted the reduction in RBC counts, which may have been due to the increased inflammatory response in ischemic stroke patients.
CONCLUSION
Our results showing improved antioxidant status in ischemic stroke patients suggest that the compensatory mechanisms operate to counter oxidative stress. Data of our study add knowledge about the oxidative stress in ischemic stroke and reinforce the antioxidant and anti-inflammatory therapeutic strategies adopted in ischemic stroke.
Acknowledgment
University Grants Commission, New Delhi, India is highly acknowledged.
Declaration of patients consent
The authors certify that they have obtained all appropriate patient consent.
Financial Support and Sponsorship
The financial support (F.No. 41-827/2012(SR)) provided to KH from the University Grants Commission, New Delhi, India.
Conflicts of interest
There are no conflict of interest.
References
- Inflammatory mechanisms in ischemic stroke: Therapeutic approaches. J Transl Med. 2009;7:97.
- [CrossRef] [PubMed] [PubMed Central] [Google Scholar]
- Estimation of serum antioxidant enzymes superoxide dismutase and glutathione peroxidase in oral submucous fibrosis: A biochemical study. J Oral Maxillofac Pathol. 2003;7:44-5.
- [Google Scholar]
- Serum antioxidative enzymes levels and oxidative stress products in age-related cataract patients. Oxid Med Cell Longev. 2013;2013:1-7.
- [Google Scholar]
- Serum antioxidant enzymes activities and oxidative stress levels in patients with acute ischemic stroke: Influence on neurological status and outcome. Wien Klin Wochenschr. 2016;128:169-74.
- [CrossRef] [PubMed] [Google Scholar]
- Antioxidant status in acute stroke patients and patients at stroke risk. Eur Neurol. 2004;51:157-61.
- [CrossRef] [PubMed] [Google Scholar]
- Oxidants, antioxidants, and the degenerative diseases of aging. Proc Natl Acad Sci U S A. 1993;90:7915-22.
- [CrossRef] [PubMed] [PubMed Central] [Google Scholar]
- Multiple roles of glutathione in the central nervous system. Biol Chem. 1997;378:793-802.
- [PubMed] [Google Scholar]
- Oxidative stress markers and their dynamic changes in patients after acute ischemic stroke. Oxid Med Cell Longev. 2016;2016:9761697. (7 pages)
- [CrossRef] [PubMed] [PubMed Central] [Google Scholar]
- Reactive oxygen species and ischemic cerebrovascular disease. Neurochem Int. 2012;60:208-12.
- [CrossRef] [PubMed] [Google Scholar]
- Erythrocyte damage and leukocyte activation in ischemic stroke. Clin Chim Acta. 2002;320:29-35.
- [CrossRef] [PubMed] [Google Scholar]
- Pivotal roles of monocytes/macrophages in stroke. Mediators Inflamm. 2013;2013:759103. (10 pages)
- [CrossRef] [PubMed] [PubMed Central] [Google Scholar]
- The ferric reducing ability of plasma (FRAP) as a measure of “antioxidant power”: The FRAP assay. Anal Biochem. 1996;239:70-6.
- [CrossRef] [PubMed] [Google Scholar]
- Low plasma antioxidant activity is associated with high lesion volume and neurological impairment in stroke. Stroke. 2000;31:33-9.
- [CrossRef] [PubMed] [Google Scholar]
- Oxidative stress in the context of acute cerebrovascular stroke. Stroke. 2000;31:1889-92.
- [CrossRef] [PubMed] [Google Scholar]
- Plasma oxidants and antioxidants in acute ischaemic stroke. J Int Med Res. 2006;34:413-8.
- [CrossRef] [PubMed] [Google Scholar]
- Evaluation of oxidative stress in patients with acute ischemic stroke. Rom J Intern Med. 2013;51:97-106.
- [PubMed] [Google Scholar]
- Oxidative stress in acute ischemic stroke. J Clin Neurosci. 2007;14:1062-6.
- [CrossRef] [PubMed] [Google Scholar]
- Superoxide dismutase activity in serum of patients with acute cerebral ischemic injury. Stroke. 1997;28:2425-8.
- [CrossRef] [PubMed] [Google Scholar]
- Antioxidant profile and early outcome in stroke patients. Stroke. 2000;31:2295-300.
- [CrossRef] [PubMed] [Google Scholar]
- Malondialdehyde, glutathione peroxidase and superoxide dismutase in peripheral blood erythrocytes of patients with acute cerebral ischemia. Eur J Neurol. 2001;8:43-51.
- [CrossRef] [PubMed] [Google Scholar]
- Overexpression of human glutathione peroxidase protects transgenic mice against focal cerebral ischemia/reperfusion damage. Eur J Neurol. 1998;53:333-8.
- [Google Scholar]
- Antioxidant status in cerebrovascular accident. Biol Trace Elem Res. 2001;80:115-24.
- [CrossRef] [PubMed] [Google Scholar]
- Protein measurement with the folin phenol reagent. J Biol Chem. 1951;193:265-75.
- [PubMed] [Google Scholar]
- Differential distribution of glutathione and glutathione-related enzymes in rabbit kidney. Biochem Pharmacol. 1984;33:1801-7.
- [CrossRef] [PubMed] [Google Scholar]
- Involvement of the superoxide anion radical in the autoxidation of pyrogallol and a convenient assay for superoxide dismutase. Eur J Biochem. 1974;47:469-74.
- [CrossRef] [PubMed] [Google Scholar]
- Oxidative stress and its role in the pathogenesis of ischaemic stroke. Int J Stroke. 2009;4:461-70.
- [CrossRef] [PubMed] [Google Scholar]
- The science of stroke: Mechanisms in search of treatments. Neuron. 2010;67:181-98.
- [CrossRef] [PubMed] [PubMed Central] [Google Scholar]
- Oxidative stress in ischemic brain damage: Mechanisms of cell death and potential molecular targets for neuroprotection. Antioxid Redox Signal. 2011;14:1505-17.
- [CrossRef] [PubMed] [PubMed Central] [Google Scholar]
- Oxidative stress in brain ischemia. Brain Pathol. 1999;9:119-31.
- [CrossRef] [PubMed] [PubMed Central] [Google Scholar]
- Pathophysiology of ischaemia-reperfusion injury. J Pathol Clin Res. 2000;190:255-66.
- [Google Scholar]
- Redox status in acute ischemic stroke: Correlation with clinical outcome. Mol Cell Biochem. 2015;406:75-81.
- [CrossRef] [PubMed] [Google Scholar]
- Role of oxidants in ischemic brain damage. Stroke. 1996;27:1124-9.
- [CrossRef] [PubMed] [Google Scholar]
- N-Acetylcysteine rapidly replenishes central nervous system glutathione measured via magnetic resonance spectroscopy in human neonates with hypoxic-ischemic encephalopathy. J Cereb Blood Flow Metab. 2018;38:950-8.
- [CrossRef] [PubMed] [PubMed Central] [Google Scholar]
- Increase in superoxide dismutase after cerebrovascular accident. Life Sci. 1994;54:711-3.
- [CrossRef] [PubMed] [Google Scholar]
- Goodsell DS. Catalase. RCSB protein data bank. 2004. Available from https://doi.org/10.2210/rcsb_pdb/mom_2004_9 [Last accessed on 2020 Dec 20].
- Preservation of cellular glutathione status and mitochondrial membrane potential by n-acetylcysteine and insulin sensitizers prevent carbonyl stress-induced human brain endothelial cell apoptosis. Curr Neurovasc Res. 2009;6:267-78.
- [CrossRef] [PubMed] [PubMed Central] [Google Scholar]
- Dynamics of free radical processes in acute ischemic stroke: Influence on neurological status and outcome. J Clin Neurosci. 2004;11:501-6.
- [CrossRef] [PubMed] [Google Scholar]
- The role of interleukin 1 in acute neurodegeneration and stroke: Pathophysiological and therapeutic implications. J Clin Invest. 1997;100:2648-52.
- [CrossRef] [PubMed] [PubMed Central] [Google Scholar]
- Red blood cell distribution width is associated with poor clinical outcome in acute cerebral infarction. Thromb Haemost. 2012;108:349-56.
- [CrossRef] [PubMed] [Google Scholar]
- Red cell distribution width and neurological scoring systems in acute stroke patients. Neuropsychiatr Dis Treat. 2015;11:733.
- [CrossRef] [PubMed] [PubMed Central] [Google Scholar]
- A novel inflammation- and nutrition-based prognostic system for patients with laryngeal squamous cell carcinoma: Combination of red blood cell distribution width and body mass index (COR-BMI) PLoS One. 2016;11:e0163282.
- [Google Scholar]
- Relation between red blood cell distribution width and inflammatory biomarkers in a large cohort of unselected outpatients. Arch Pathol Lab Med. 2009;133:628-32.
- [CrossRef] [PubMed] [Google Scholar]
- The relationship between stroke mortality and red blood cell parameters. Iran J Neurol. 2014;13:237-40.
- [PubMed] [PubMed Central] [Google Scholar]


