Translate this page into:
Analysis and modeling of morbidity and mortality from coronavirus outbreak in Brazil: A case study of public health challenge using unique statistical tools
Corresponding author: Dr. Mostafa Essam Eissa, Department of Microbiology and Immunology, Microbiological Research Facility, 11511 Cairo, Egypt. mostafaessameissa@yahoo.com
-
Received: ,
Accepted: ,
How to cite this article: Eissa ME, Rashed ER. Analysis and modeling of morbidity and mortality from coronavirus outbreak in Brazil: A case study of public health challenge using unique statistical tools. J Health Sci Res 2023;8:57–61.
Abstract
The emerging outbreak of COVID-19 provided a valuable lesson for the global readiness with regard to the impact of the disease and management of the pandemic. The present case study reported the magnitude and public health effect based on the daily morbidity and mortality metrics from the coronavirus epidemic in Brazil as part of a series of investigations regarding the pattern and behavior of the outbreak with different geographical regions using the Pareto principle focusing on the major contributors of the worldwide pandemic. There were observable signs of multiple overlapping waves for the reported cases and deaths when using process-behavior (trending) charts. The cumulative daily census showed a significant approach to Morgan-Mercer-Flodin (MMF) model as a primary fit followed by exponential association as a secondary option with good regression. A simple and effective statistical description of the pandemic could be used as a quantitative measure for the effect of the outbreaks on the populations in a specific political region with the ability to compare between pre- and post-action events and different districts.
Keywords
Brazil
COVID-19
MMF model
Trending chart

INTRODUCTION
The coronavirus disease 2019 (COVID-19) has impacted the whole world for more than 2 years, and it still affects all countries despite the national and international efforts to contain this viral outbreak.[1] Extensive official and nonofficial organizations and authorities have provided close monitoring and recording of the outcome of exposure to this disease.[2,3]
One of the most crucial markers of this disease is the timeline, of morbidity and mortality, which measures the epidemiological progression based on political regions defined by the World Health Organization (WHO).[4–6] These public health indicators are direct measures of health and illness status in each country.[7,8] Also, they pinpoint the effect and relationship with the economy, public awareness, governmental control, adequacy of official authority measures, and feasibility of resources. Moreover, effective implementation of scientific and medical knowledge cannot be ruled out as a critical factor.
The present case study discussed herein investigates one of the most affected political regions with the latest coronavirus outbreak using a comprehensive dataset for both reported cases and deaths as measures for public health confrontation with the epidemic. In addition, the quantitative and descriptive analyses would be useful for health professionals to study and investigate the outbreak.
CASE REPORT
The present case report provided a long-term investigation of the effect of COVID-19 on public health using both mortalities and morbidities as measurable indexes for the severity of the pandemic and the time-bound extension of the disease. The dataset of the dedicated country was extracted using the Humanitarian Data Exchange (HDX) v1.66.1 PY3 (https://data.humdata.org/event/covid-19).[9] Data harvest was conducted between 03 January 2020 and 14 January 2022 covering about 24.4 months (2 years) of the records. Cases and deaths in Brazil were arranged chronologically along with the cumulative morbidities and mortalities on a daily basis. Logarithmic transformation (to the base ten) on the cumulative datasets was performed and a unity value was added to the raw data to compensate for zero values without distorting the original record. The whole previous process was conducted in Microsoft Excel Sheet. Trending (control) charts were constructed using statistical software. Modeling of the transformed cumulative data was investigated using a curve-fitting program.
DISCUSSION
The present case analysis provides herein an examination of the major nations that have been devastated by the latest pandemic involving coronavirus disease – in terms of morbidities and mortalities[10] – as part of a global screening for quantitative investigation and descriptive statistical analysis to provide measurable metrics in terms of cases and deaths, in addition to forecasting.
Regression analysis of logarithmic transformed cumulative deaths (log C.D.) versus logarithmic transformed cumulative cases (log C.C.)
The regression equation is Log C.D. = −0.3759 + 0.8309 Log C.C., where S = 0.226243, R-Sq = 98.3% and R-Sq(adj) = 98.3%.[11] Analysis of the source of variances (ANOVA) for the total degree of freedom (DF) of 742 and sum of squares (SS) of 2288.66 showed an error with mean square (MS) of 0.05 and SS of 37.93 for 741 DF.[11] The regression factor computed for DF of unity gave 2250.73 SS, 2250.73 MS, and F of 43971.87 for P 0.001. [Figure 1] shows three-dimensional kinetics of the daily morbidities and mortalities due to the coronavirus outbreak in Brazil with evidence of a rising trend in both monitored cases and deaths observed as a short valley (a period of relative calm and decline in the census) in-between initial small and late large peaks.[12] The shape of both cases and deaths showed a similar general outline.

- Three-dimensional graph showing the kinetics of daily cases and deaths with elapsed time of the COVID-19 outbreak in Brazil.
Emerging daily cases and deaths: correlation and change over investigation period
A strong correlation was found (≈ 0.9151) between new daily cases and deaths using Spearman (nonparametric at 95% significance level) test.[13] For 743 daily observations, there is a significant low positive correlation between the number of cases and deaths with the epidemic duration elapsed with r and 95% confidence interval (CI) of 0.2975, 0.2301, and 0.2285 to 0.3636, 0.1587, to 0.2990, respectively, at α = 0.05 and P (two-tailed) 0.0001. [Figure 2] illustrates the daily rate dynamicity in chronological order.
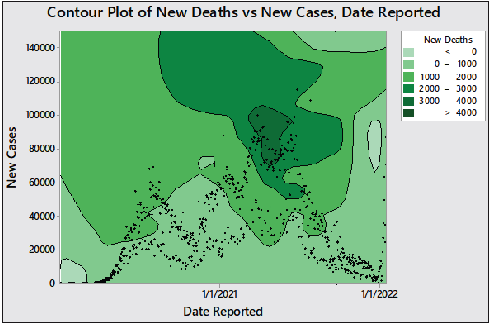
- Contour plot showing the distribution of cases and deaths in chronological occurrence.
Monitoring daily morbidity and mortality using time-series chart and curve smoothing
Individual-moving range (I-MR) charts were used as an exploratory visualization to monitor the progress of new cases and deaths daily.[14,15] The presence of abnormally high or low counts is indicated by a red dot marked with “1.” There is an initially calm and lag period with no observable casualties and this is a usually low trend in comparison with the whole pattern followed by a shift in the outbreak centering count or variation of the inspection characteristics (indicated by “2”) marking the start, in-between or overlapping, and the end of the epidemic waves.[16] The least frequent alarm is “3” marking the pattern that could be found between the two major peaks. The appearance of excessive points “5” and “6” are indicative of the appearance of multiple small drifts in the number of cases and deaths. It should be observed that a sign of a mixture pattern was detected (number “8”), suggesting that mixed waves of COVID-19 were involved in the major large waves and sub-waves observed as clusters in multiple locations in the trend line. The above outcome was deduced from the “I (Individual)” figure. The associated variations in the daily record (MR) chart is indicative of unstable variations, which were apparent in higher frequency in the second half of the examination period.[16] Curve smoothing in [Figures 3 and 4] showed a sign of two mixed waves in the first peak and five overlapping waves in the second one.
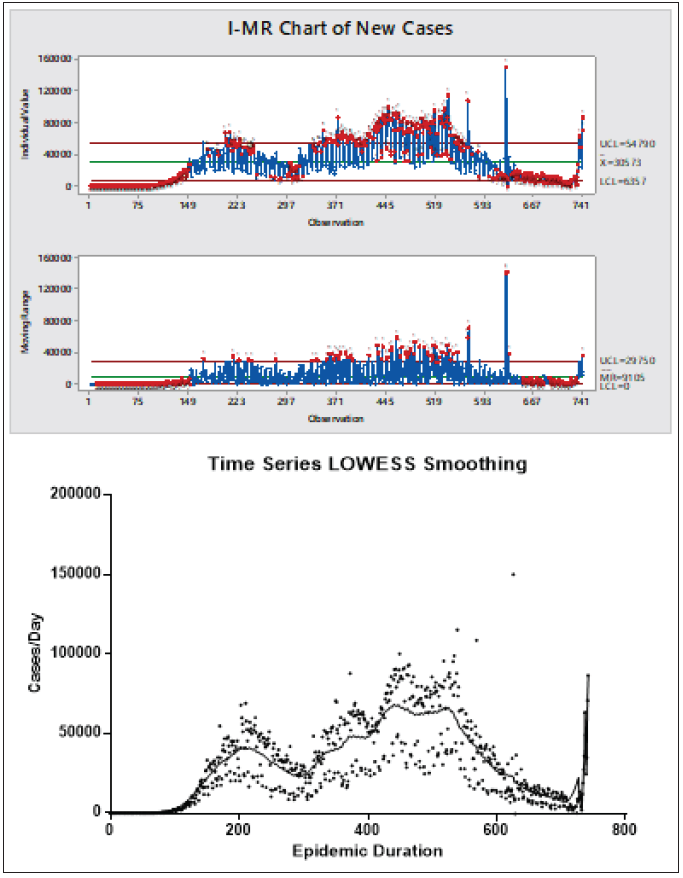
- Process-behavior chart and spline/LOWEES curve smoothing of morbidity time series plot.

- Process-behavior chart and spline/LOWEES curve smoothing of mortality time series plot.
Empirical modeling of transformed cumulative daily morbidities and mortalities
The common best fit empirical model for the logarithmically transformed daily cases and deaths was the Morgan-Mercer-Flodin (MMF) model, which is expressed generally as in equation 1.[17] [Figure 5] demonstrates the pattern of the cumulative morbidities and mortalities with the best fitting model is shown.
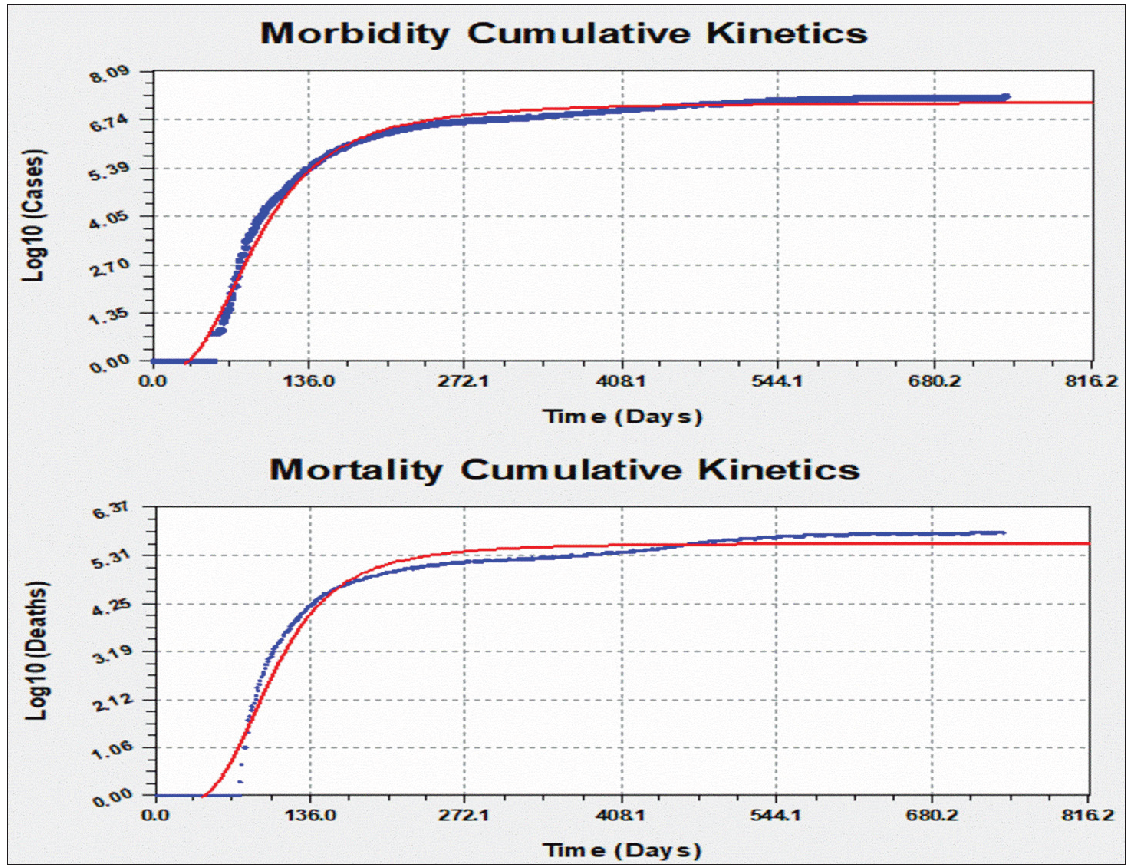
- Daily kinetics modeling of COVID-19 of the logarithmically transformed cumulative morbidity and mortality in Brazil.
where a, b, c, and d are constant factors showing the change of either morbidity or mortality (y) as a factor in time (x) in days. The coefficient data for cases and deaths are a = −3.57489173401E-001, b = 2.84649717724E+005, c = 7.21239888210E+000, and d = 2.78000960509E+000 and a = −2.51177079453E-001, b = 1.56381119463E+007, c = 5.57103060684E+000, and d = 3.57951568274E+000, respectively. For cumulative cases, the standard error was 0.1978332 with a correlation coefficient of 0.9955540. The fit converged to a tolerance of 1e-006 in 75 iterations and no weighting was used.[18] For cumulative deaths, the standard error was 0.2400384 and the correlation coefficient was 0.9907293. The fit converged to a tolerance of 1e-006 in 94 iterations and no weighting was used.
First-level differentiation of morbidities and mortalities as a function of time
In the previous equation, if x = zero, y = a, the curve would demonstrate the countdown time for the start of the first incident theoretically either for the emergence of the reported cases or deaths. One-time derivatization yielded equation 2, which expresses the change of both cumulative cases and deaths with logarithmic transformation (to base ten) with respect to the elapsed time.[19]
when x equals a unity, equation 2 shows a constant characteristic factor for each public health marker of the epidemic. This is demonstrated by equation 3 showing the daily Factor (F). The F-factor is influenced directly by the rise in c and d values but decrease by the increase in a and b. These constants are indicators for the outbreak rate and magnitude of the cases and deaths. It can be estimated for cases (Fc) and deaths (Fd) and used for comparison between different geographical regions, in addition to pre- and post-public health and regulatory actions to estimate the magnitude of improvement or deterioration in the pandemic situation.
CONCLUSION
The waves of the outbreak exhibited bottoms and tops without rest, which is exhausting for the country’s resources and public health authorities, in addition to the community. However, major peaks could be identified without signs of the disease recession. While the mortality rate is low as could be expected for this Severe Acute Respiratory Syndrome CoronaVirus 2 (SARS-CoV-2), yet it reflects – from the current and previous analyses – that the world is not prepared for the worst-case scenario of much more dangerous microbial pandemics with high mortality rates.[20] The gross approximation of the mortality rate from the impacted populations (using the process-behavior charts) showed that the mean mortality rate was 2.73% with a relative standard deviation percent (RSD%) of 11.17. The trending charts have distinct patterns that were associated with the applied alarming points. The containment of the surge in morbidities and mortalities was hard to achieve despite actions initiated by the authorities in the country, which is reflected in the instability of the daily variations. Major unequal peaks of the outbreak could be detected as two interfering broad elevations that embraced multiple overlapping waves. Curve fine smoothing – using parameter fit by spline/lowess – was used to expose these small close waves.
Transformation of datasets has proved in other works that it has the advantage of minimizing the effect of noise and aberrant values that could not be excluded due to the lack of reasonable justification in the row results of the monitored phenomena. The use of polynomial modeling was avoided to prevent unrealistic and poor extrapolation; in addition, the selection of the order could be impacted by the magnitude of noise with the resultant overfitting leading to a nonlogical or complex interpretation. The MMF model showed previously good fitting with cumulative data but in the original nonmodified form. The exponential association was found also to show acceptable fitting but with slightly lower regression. The elicited derivatization equation for cases and death rates was implemented as a measurable indicator for the public health impact of the epidemic in the country as a quantitative metric for assessment and comparison to be used by regulatory authorities and governmental agencies.
Acknowledgment
None to declare.
Declaration of patients consent
Patient’s consent not required as there are no patients in this study.
Financial support and sponsorship
Nil.
Conflicts of interest
There are no conflict of interest.
References
- The global impact of the coronavirus pandemic. Cytokine Growth Fact Rev. 2020;53:1-9.
- [Google Scholar]
- A COVID-19 válság integrációs hatásai (The impact of the COVID-19 crisis on integration) Köz-gazdaság. 2020;15:5-12.
- [PubMed] [Google Scholar]
- Effect of COVID‐19 on health system integration in the Netherlands: a mixed‐methods study. J Am Coll Emerg Physicians Open. 2021;2:e12433.
- [CrossRef] [PubMed] [PubMed Central] [Google Scholar]
- Emerging Pandemic Diseases: How We Got To COVID-19. Cell. 2020;183:837.
- [CrossRef] [PubMed] [PubMed Central] [Google Scholar]
- Global influenza programme. Pandemic influenza preparedness and response: a WHO guidance document. Geneva. World Health Organization. 2020;173:362-367.
- [Google Scholar]
- Prevalence of asymptomatic SARS-CoV-2 Infection: A Narrative Review. Ann Intern Med.. 2020;173:362-367.
- [CrossRef] [PubMed] [PubMed Central] [Google Scholar]
- Bien J, Kim PY. Epidemiology morbidity and mortality. nih.gov. StatPearls Publishing; 2019. https://www.ncbi.nlm.nih.gov/books/NBK547668/ [Last accessed on 2022 Dec 23].
- Measuring the public’s health. Public Health Rep.. 2006;121:14-22.
- [CrossRef] [PubMed] [PubMed Central] [Google Scholar]
- OCHA Services. COVID-19 Pandemic - Humanitarian data exchange. data.humdata.org. v1.66.1 PY3; 2022. https://data.humdata.org/event/covid-19 [Last accessed 2022 Dec 26].
- Eissa M, Rashed E, Eissa D. Implementation of the Pareto principle in focus group generation based on global coronavirus disease morbidity and mortality rates. Highlights in Biosci. 2022;5. https://doi:10.36462/H.BioSci.202204 [Last accessed 2022 Nov 14].
- Minitab manual. Upper Saddle River, NJ: Prentice Hall; 2003.
- Industrial statistics with minitab. John Wiley & Sons; 2012.
- Fitting models to biological data using linear and nonlinear regression. Oxford University Press; 2004.
- Monitoring of cryptosporidium spp. outbreaks using statistical process control tools and quantitative risk analysis based on nors long-term trending. Microbiol J.. 2019;9:1-7.
- [Google Scholar]
- Long-term monitoring of cancer mortality rates in USA: A descriptive analysis using statistical process control tools. Iberoam J Med. 2020;2:55-60.
- [Google Scholar]
- Growth of D614G Virus: Morgan – Morgan – Finney (MMF) Regression. Research Square 2020
- [Google Scholar]
- The growth curve of gompertz model in body weight of mixed-sex goose breeds in Slovakia. GABJ. 2021;5:28-32.
- [Google Scholar]
- Eissa M. Quantitative Analysis of COVID-19 Pandemic A Case Study of Upper-MiddleIncome Country. www.asianhhm.com. 2022. Available from: https://www.asianhhm.com/articles/application-of-industrial-statistical-tools-in-quantitative-analysis-of-covid-19-pandem [Last accessed 2022 Dec 26].
- Modeling of COVID-19 major outbreak wave through statistical software: quantitative risk evaluation and description analysis. Eskişehir Türk Dünyası Uygulama ve Araştırma Merkezi Halk Sağlığı Dergisi. 2022;7:145-61.
- [PubMed] [Google Scholar]